
Infographic Design Agency Berlin – Information Design, Data Visualization & Data Storytelling
Infographics are the best way to communicate complex knowledge effectively and to the right audience
Our internationally award-winning infographic editorial team develops infographics and data visualizations for topics that are complex, multi-layered, and socially relevant — whether as a print publication, interactive application, strategic visualization, or spatial knowledge format.
What good information design has to achieve
Infographics are the Swiss Army knife for complex transformation projects
Reducing complexity
A good infographic makes even demanding content accessible without flattening it into meaninglessness. It creates clarity without losing precision.
Making connections visible
Numbers alone say little. Real orientation only emerges once relationships, dynamics, and mechanisms of effect become recognizable.
Quick to grasp, substantial in content
Infographics need to work at first glance and still hold substance on the second. Good visual communication invites people in and holds up to critical scrutiny.
Bringing people along
Good data visualization isn't just formally clean, it's also relatable. It meets different audiences where they are, even when the topic is complex or dry.
Shareable, usable, and versatile
A strong infographic doesn't just work in a single report. It carries across slides, social media, websites, exhibitions, or print formats, and keeps its impact wherever it goes.
A reel says more than 1,000 words
Our infographic world in 90 seconds
How we work
We explain complex content so people understand faster what it's about and why it matters
Editorial groundwork
For us, infographics don't start with layout
Before we design anything, we sort content, sharpen statements, and check what's actually relevant. That's exactly why we work with our own infographic editorial team. They help condense complexity so it becomes accessible without losing its core. For us, that's the difference between decorative visualization and information design that actually holds up.
Audience-appropriate communication
Reaching people you'd lose with plain text
Plenty of content is relevant but not inherently engaging. Technical, political, or scientific topics need formats that spark interest before overwhelm sets in. That's why we answer two questions early on: Why is this interesting? And what does it mean for me personally? That shortens the path into the topic considerably.
Data storytelling
Finding the stories inside data
A table or a pie chart doesn't tell a story on its own. Only through selection, weighting, and smart dramaturgy does what's genuinely interesting become visible. We help find the story inside complex datasets — not as supporting illustration, but as analytical condensation with narrative power. Sometimes that results in data comics, infographic coloring books, or data sculptures.
Infographics in change processes
Making strategy visible so people can connect with it
In transformation processes, having a goal isn't enough. People need to quickly understand what it's about, why it matters, and where they fit in. That's exactly where our strategy and process visualizations come in. They translate abstract programs, change initiatives, or future visions into a form that provides orientation and enables further conversation.
Infographics for participation
Infographics as an invitation to think along
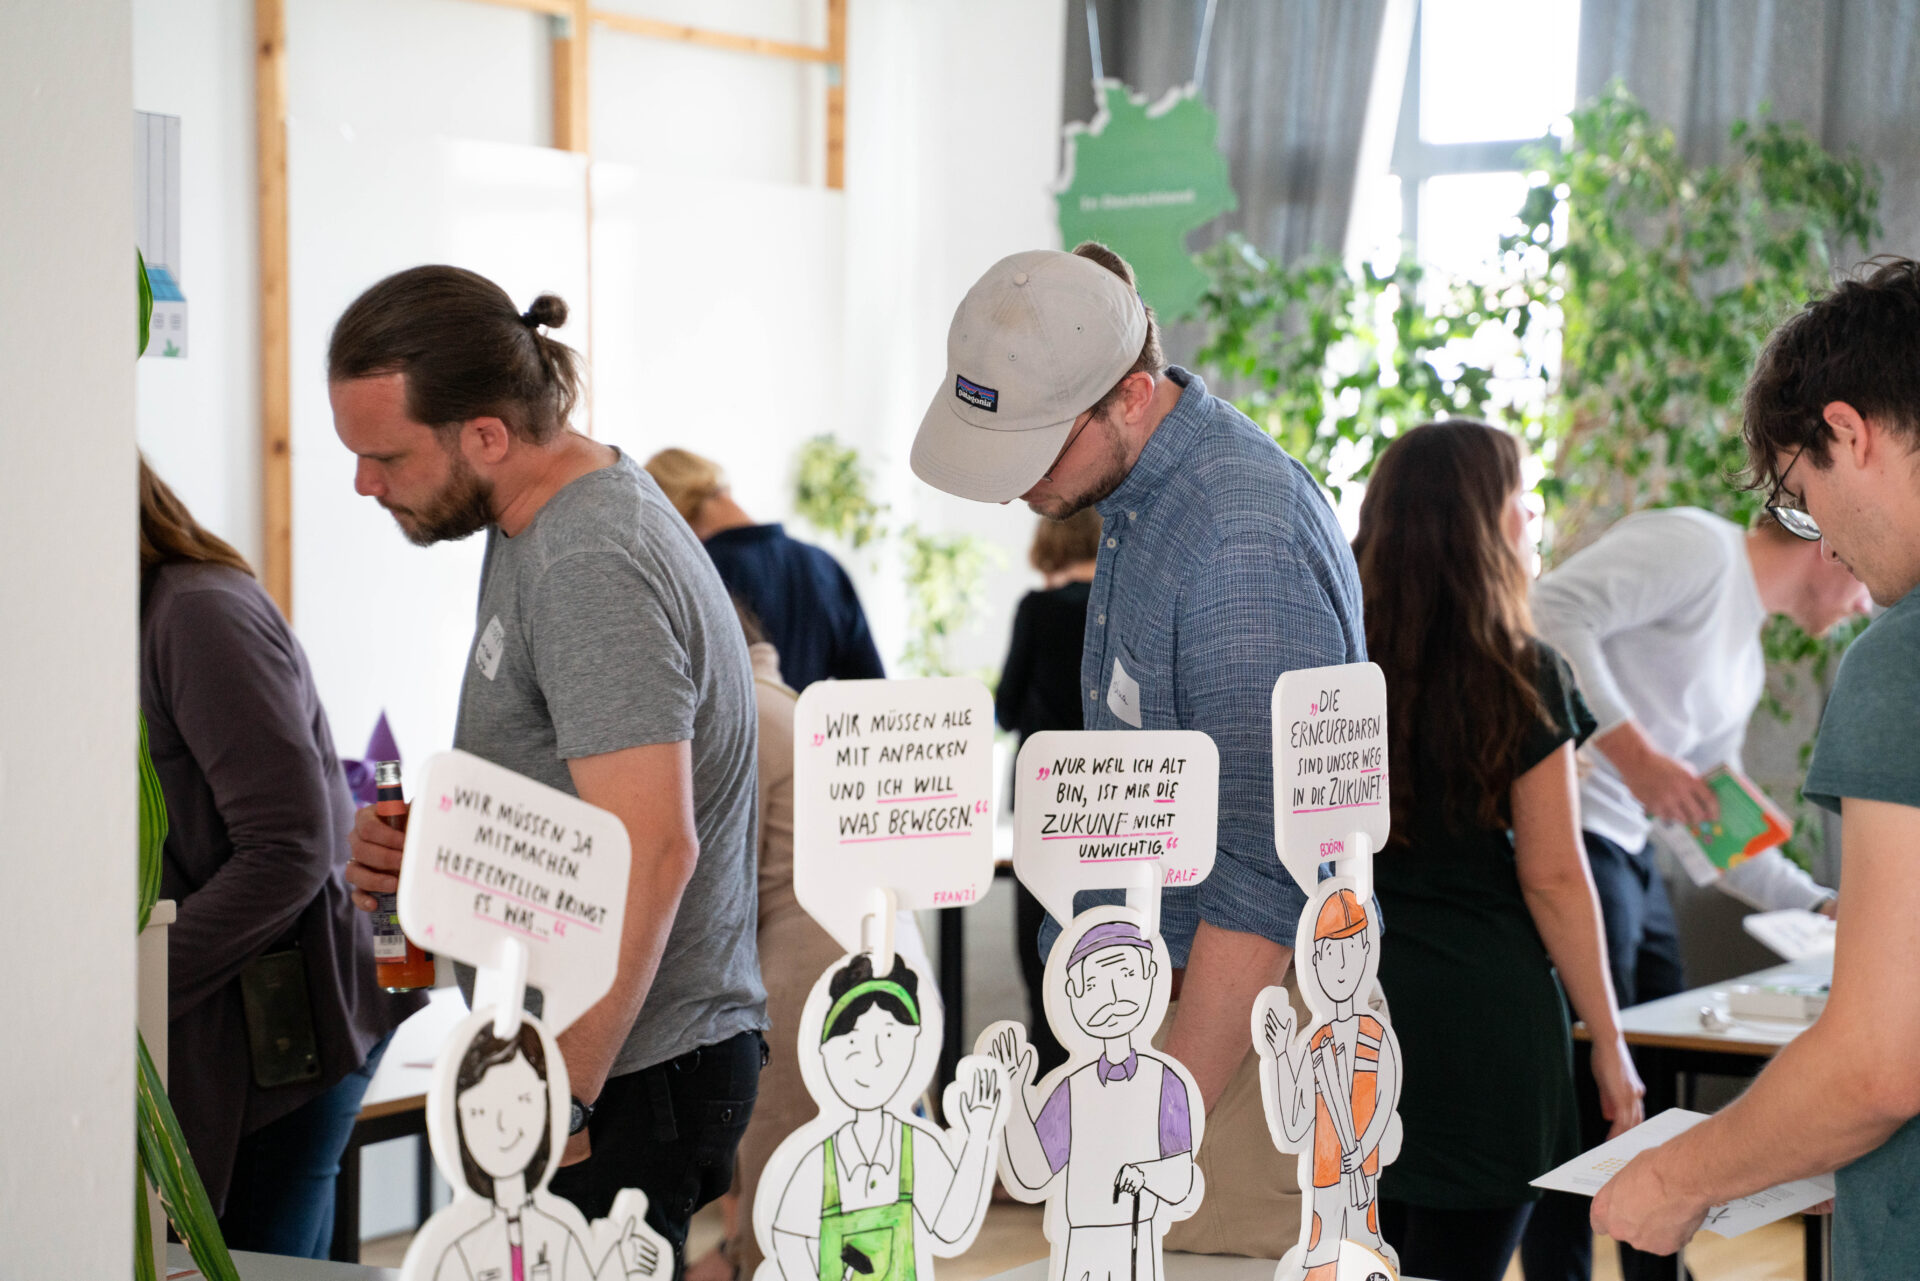
Anyone meant to have a say first needs an understandable way in. Especially with complex topics, infographics create that initial threshold. They bring people into the topic quickly, provide orientation, and make participation possible in the first place. That's how visual communication becomes the starting point for informed input.
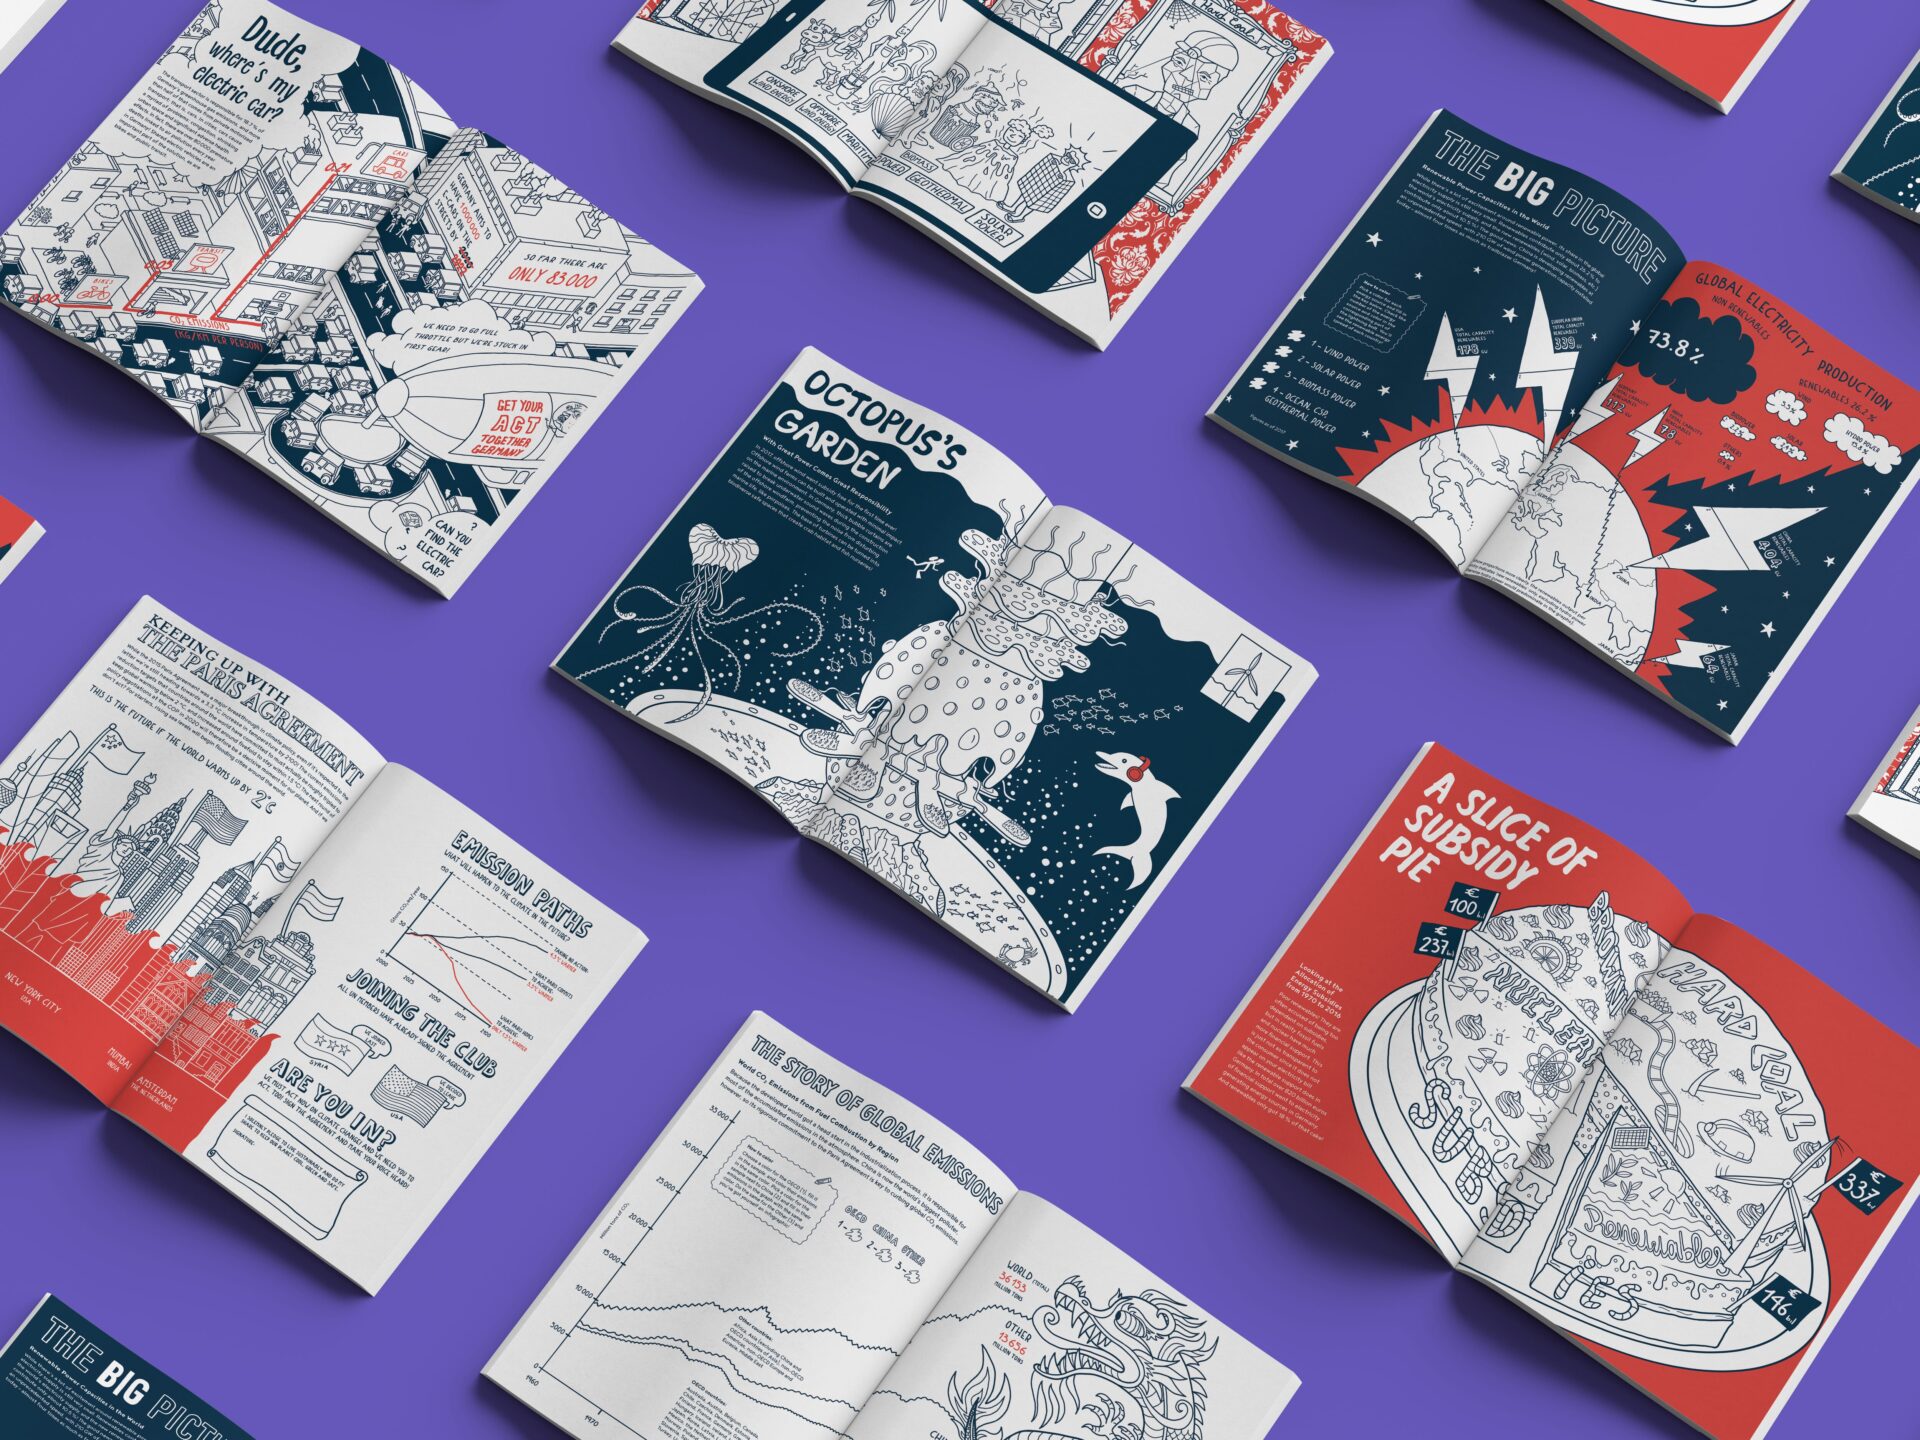
Training and workshops
Building infographic skills within your team
Good visual communication doesn't always have to stay external. We help organizations build their own infographic capacity, for example through introductory training, data storytelling, visualization workshops, or setting up internal infographic editorial teams. That way, you get not just individual good graphics, but structures that carry you long-term.
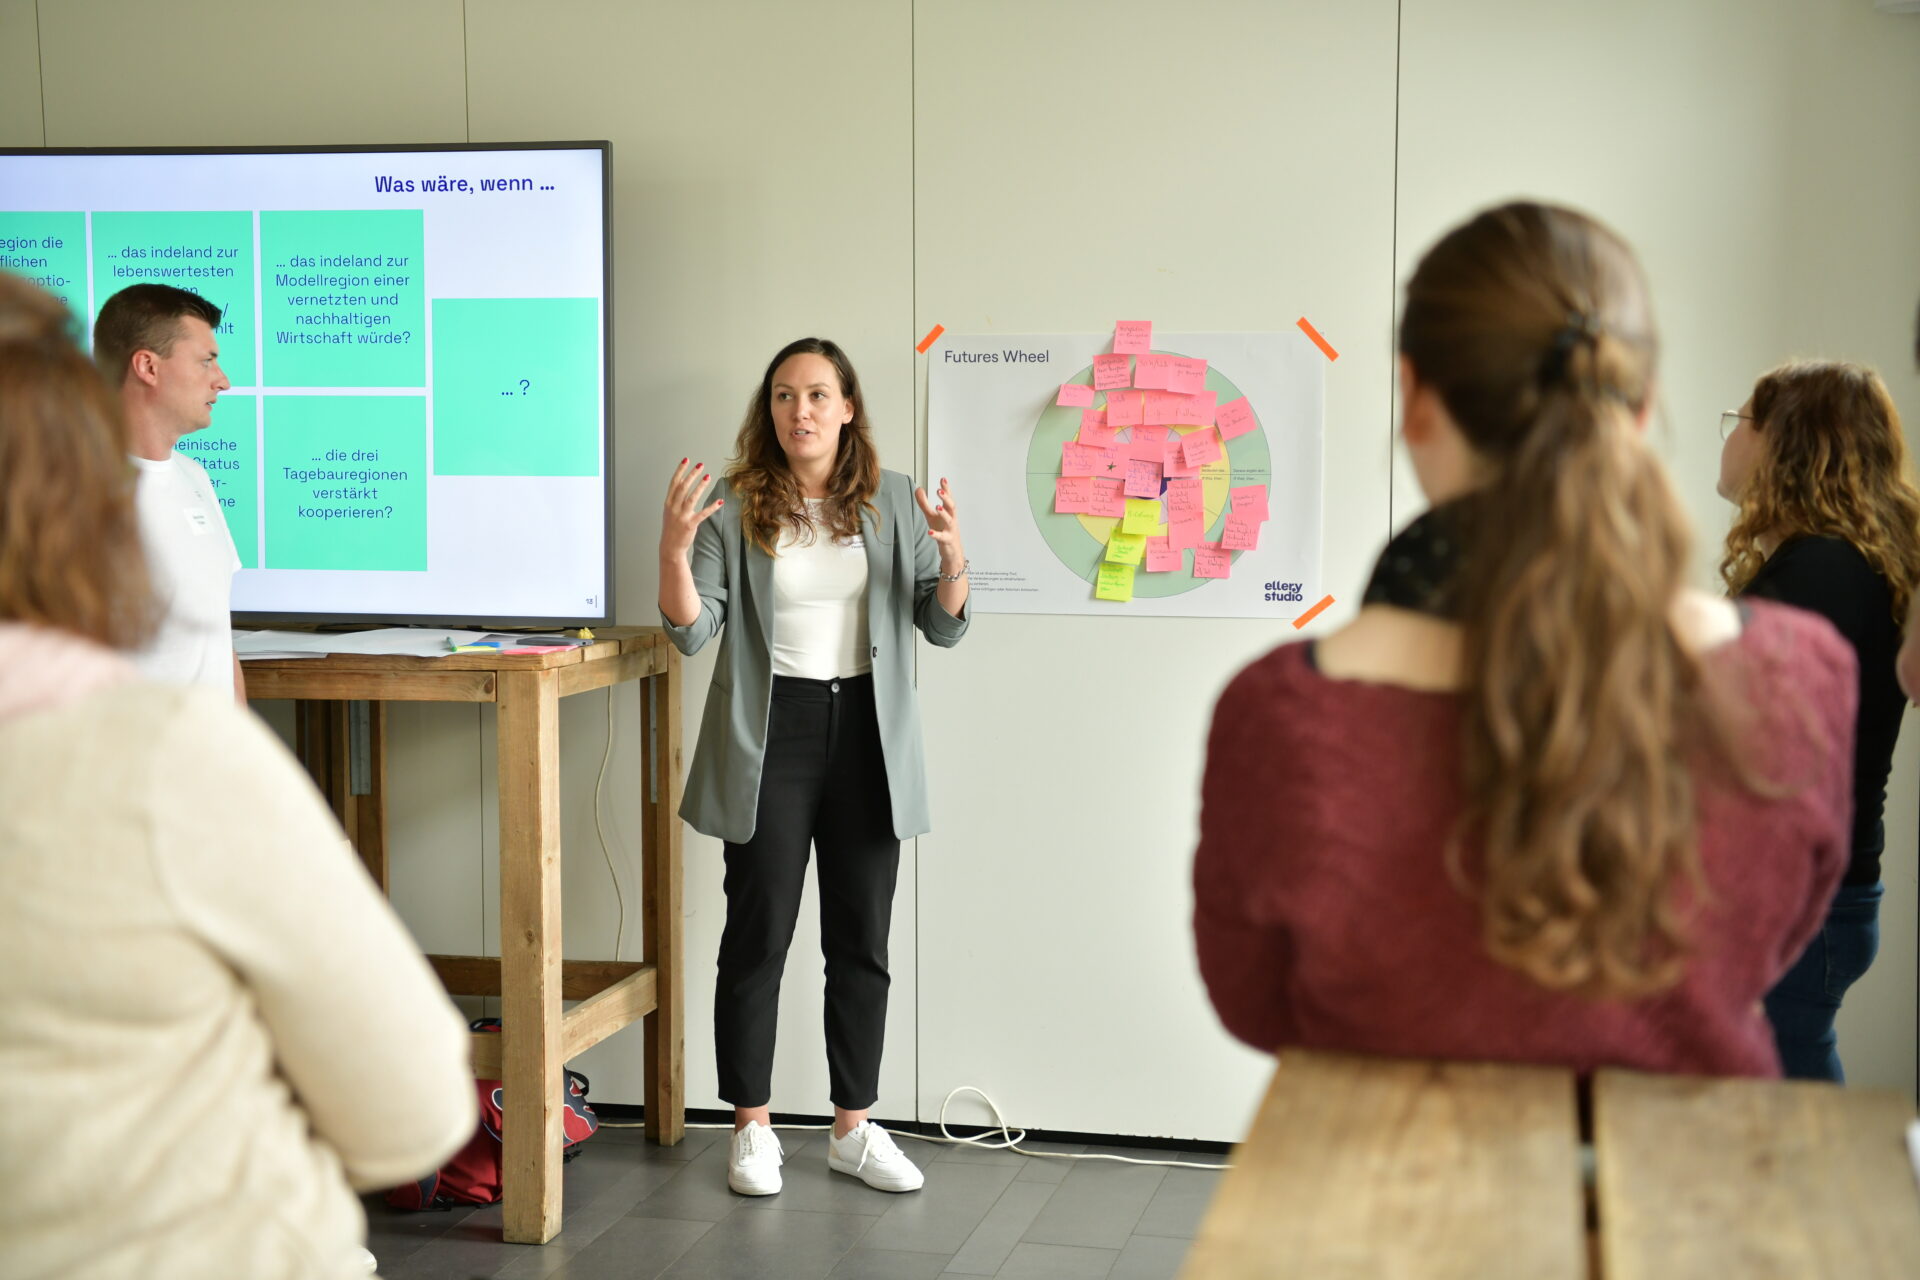
A look into our project world
This is what it looks like when we bring content, structure, and design together
Pioneering infographics since 2014
Sounds good? It gets even better once we get started together. Our five-person infographic editorial team translates complex content into clear visual stories.
400+
successful infographic projects
13
years of experience
17
international awards
8
in-house infographic publications
What our infographic design agency offers in infographics and data visualization
From expertise to visual clarity
Creating a great infographic takes a careful combination of subject-matter expertise, creativity, and communication skill, plus experience in co-creative collaboration with subject experts.
Explanatory infographics
For complex relationships, processes, systems, or political questions that need to become understandable at a glance.
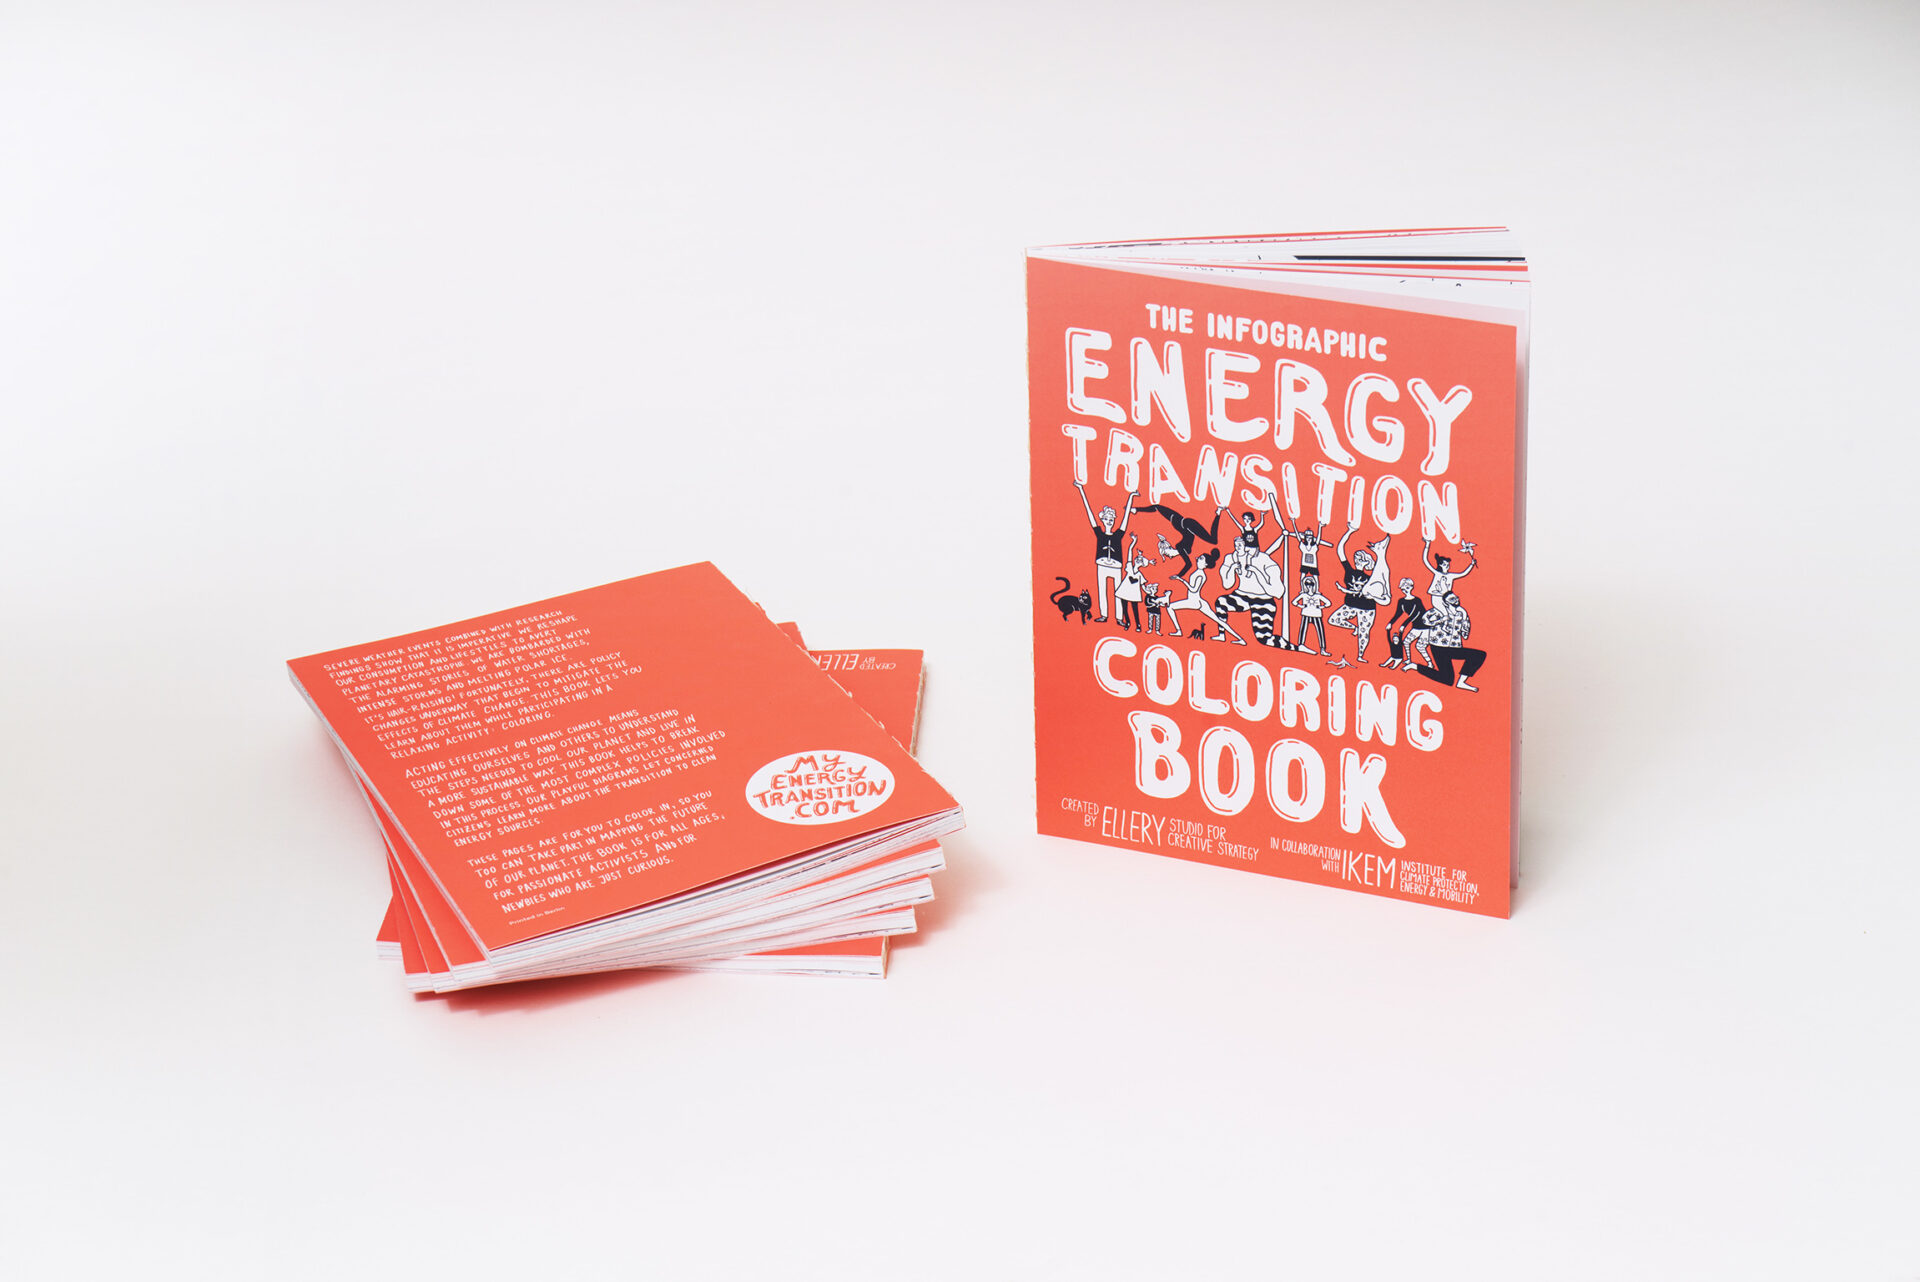
Data visualization and data storytelling
For figures, trends, and developments that need to be not just correctly displayed, but made intuitively readable and interpretable through data storytelling.
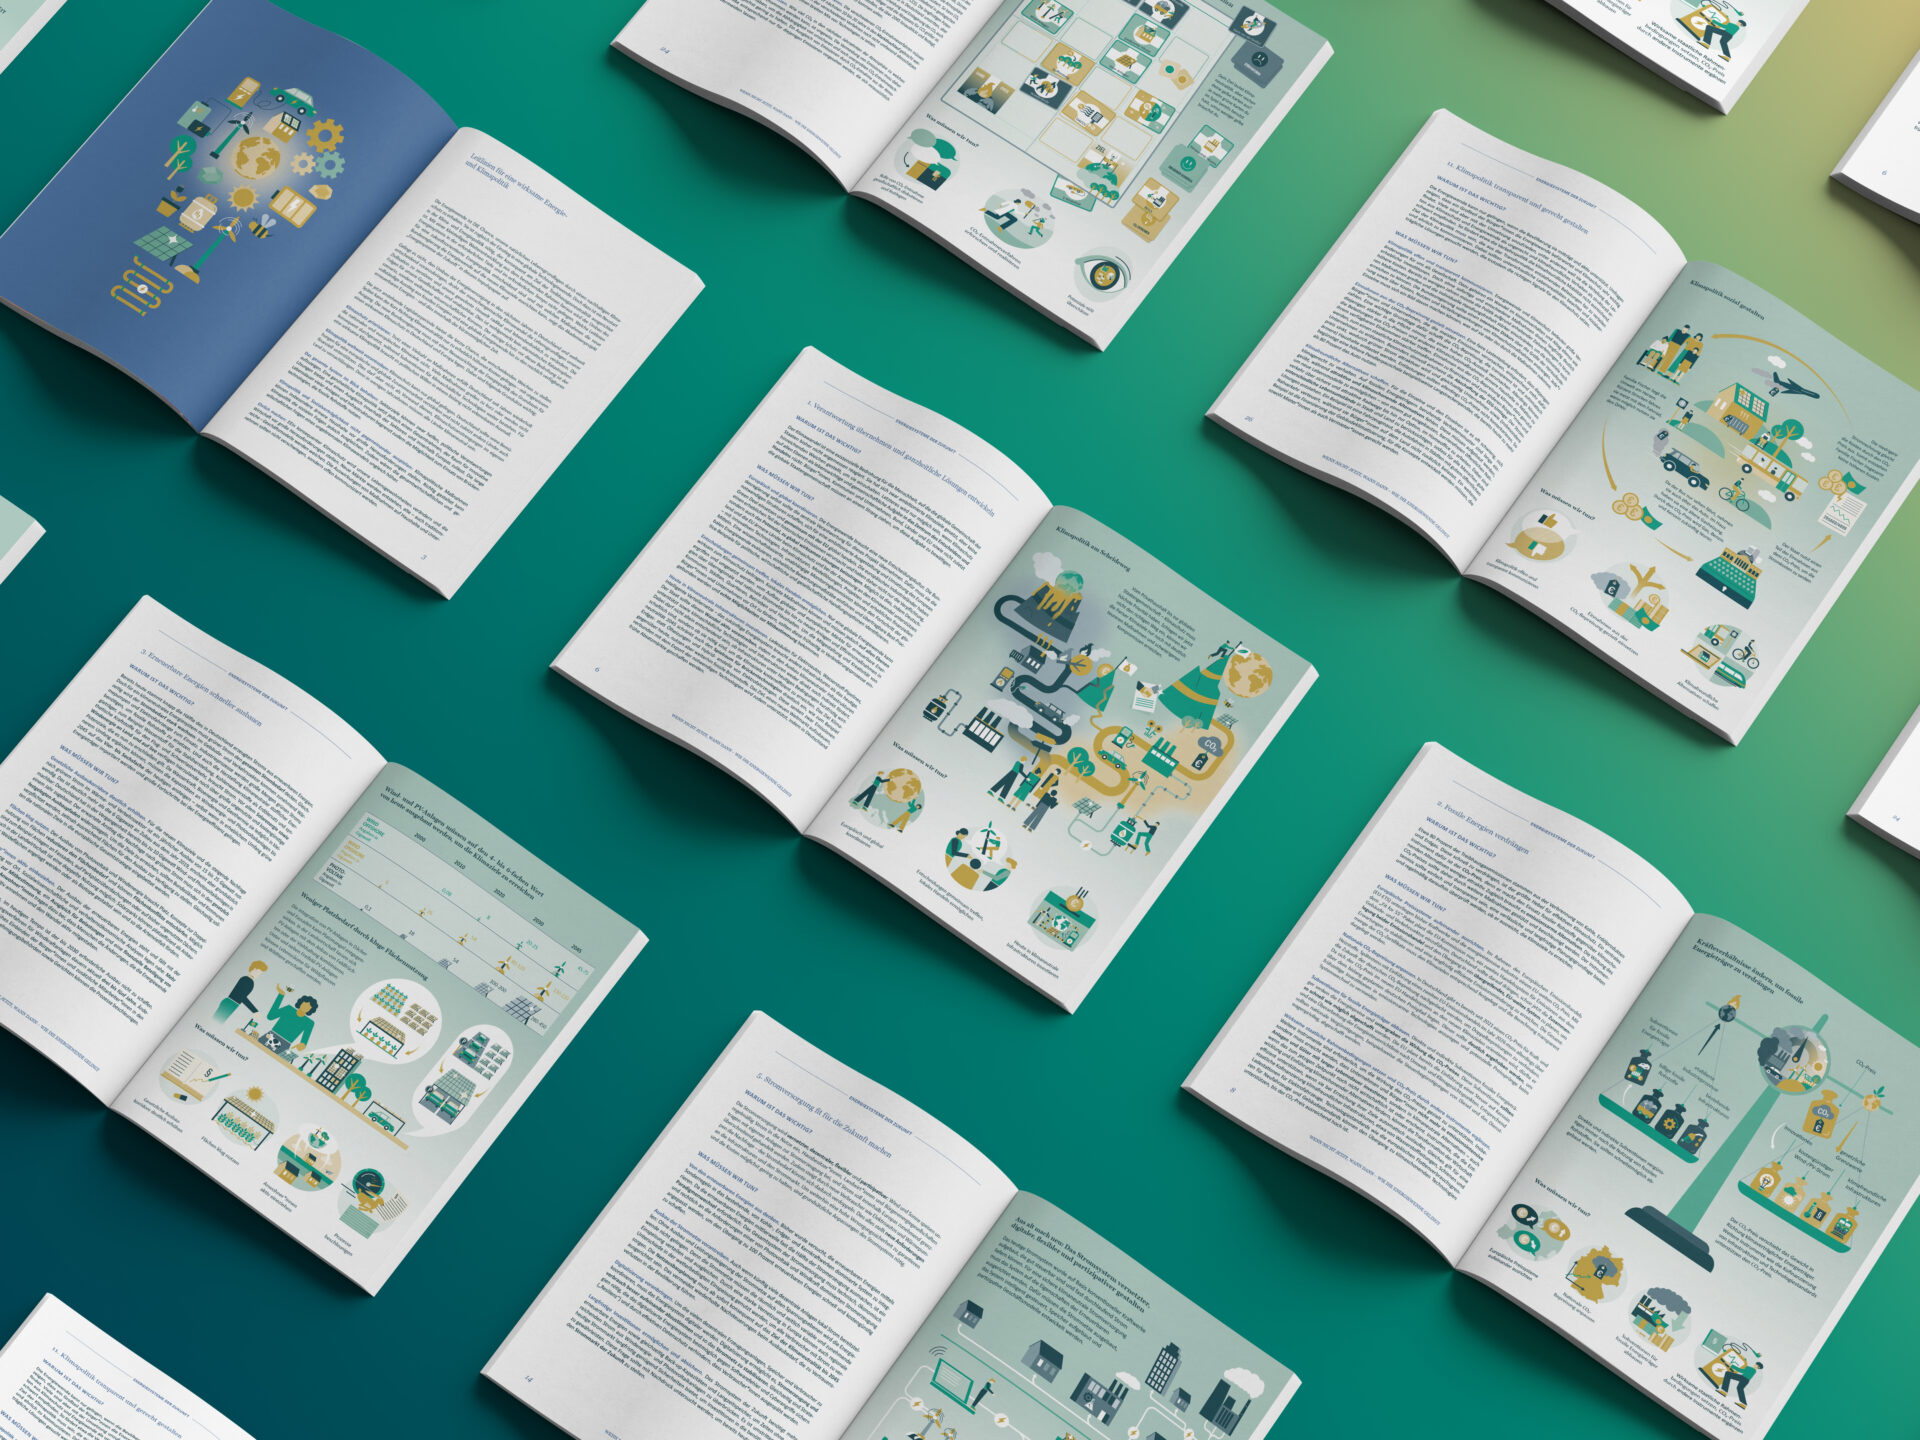
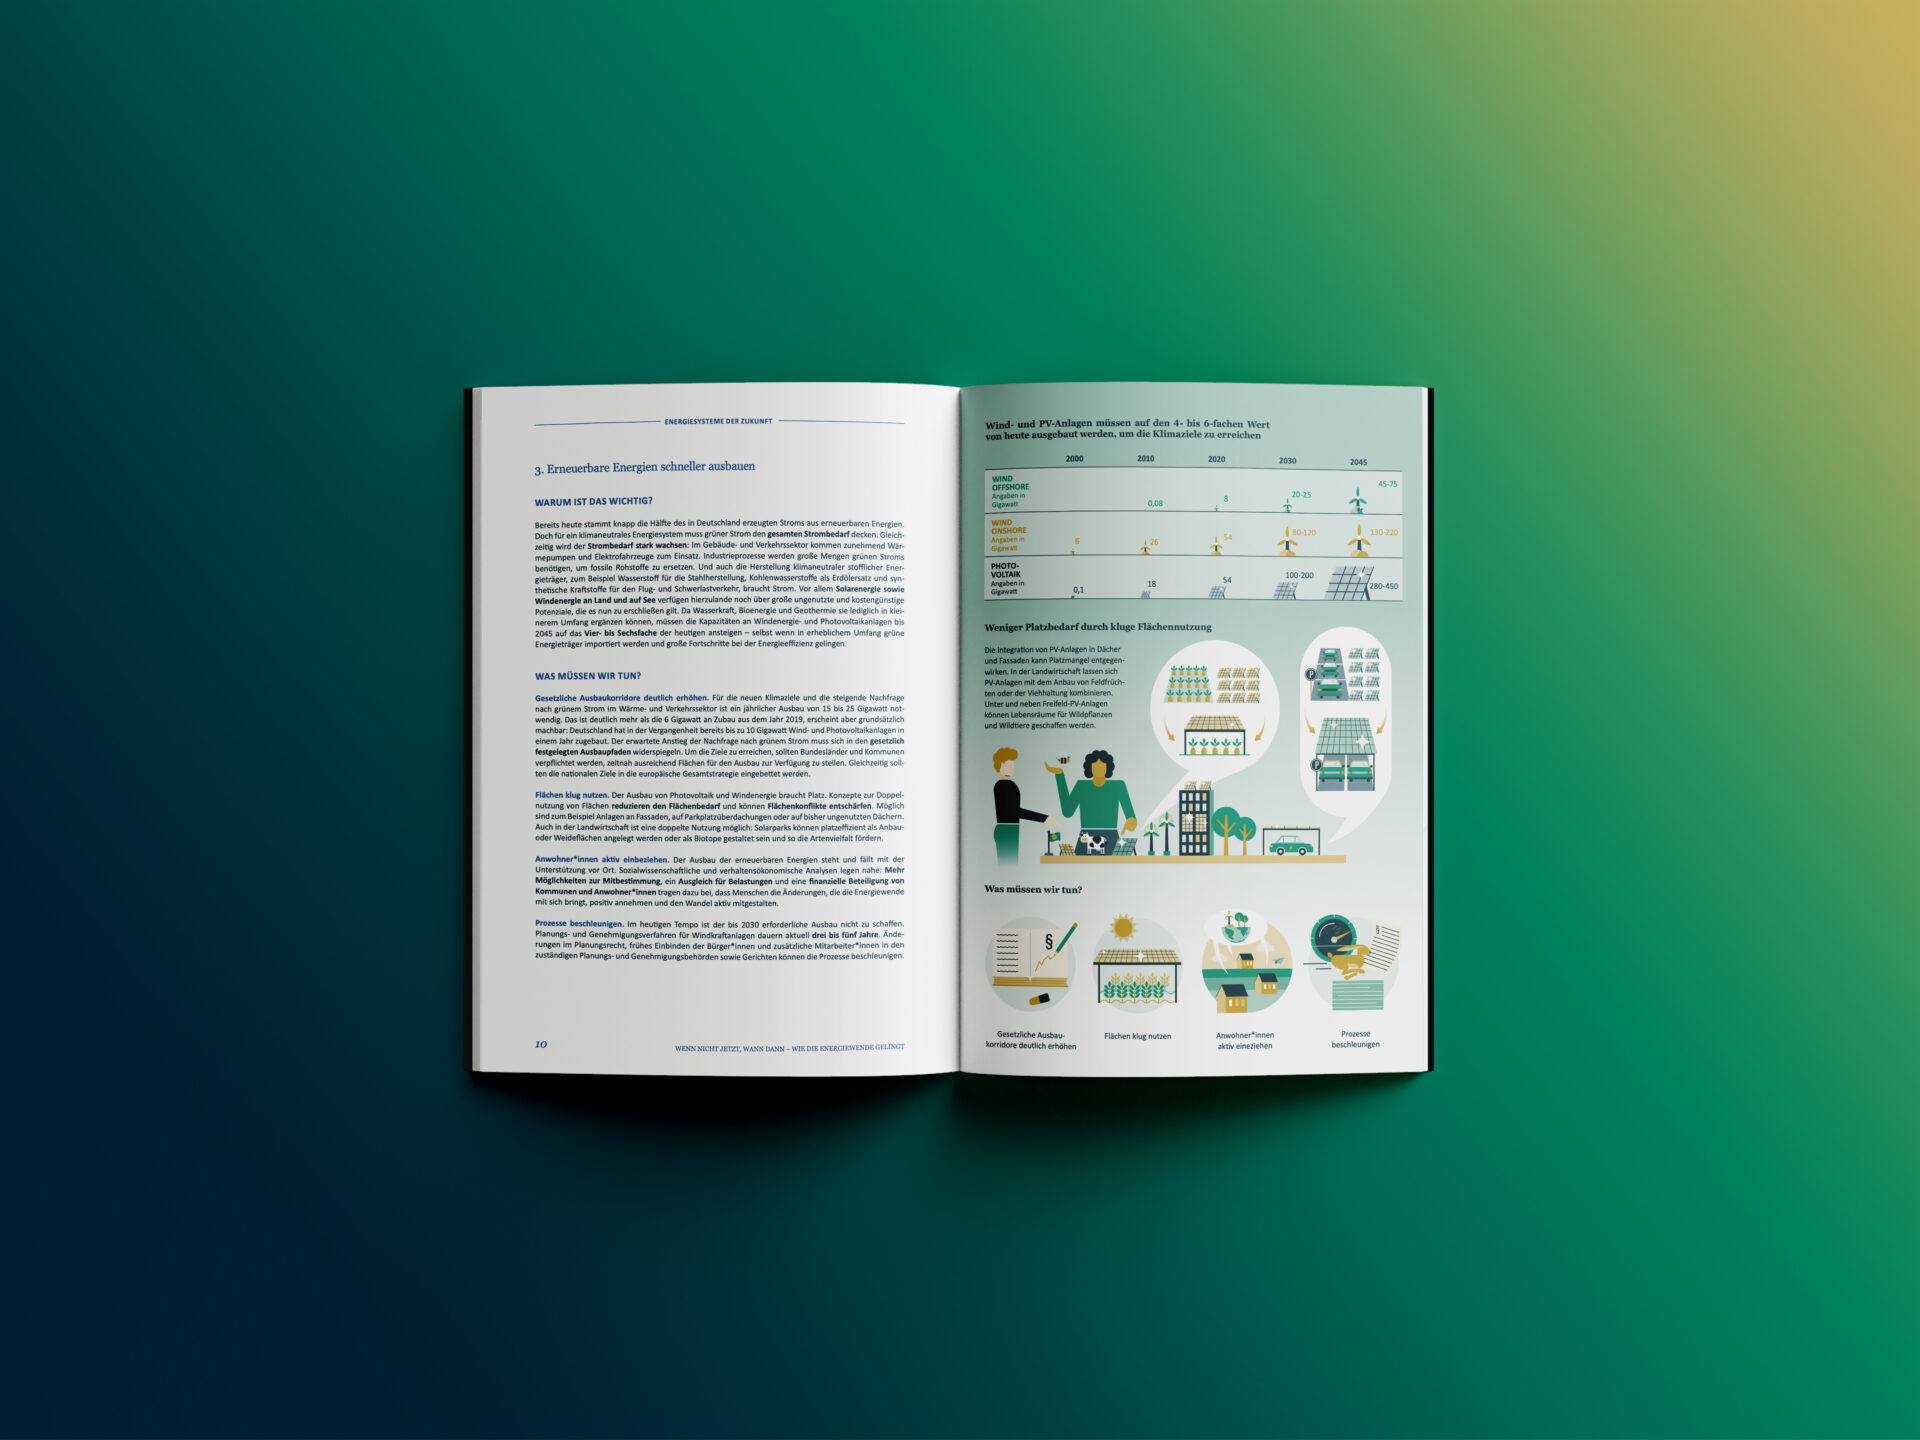
Editorial infographics
For reports, studies, magazines, and books where visual clarity and depth of content come together.
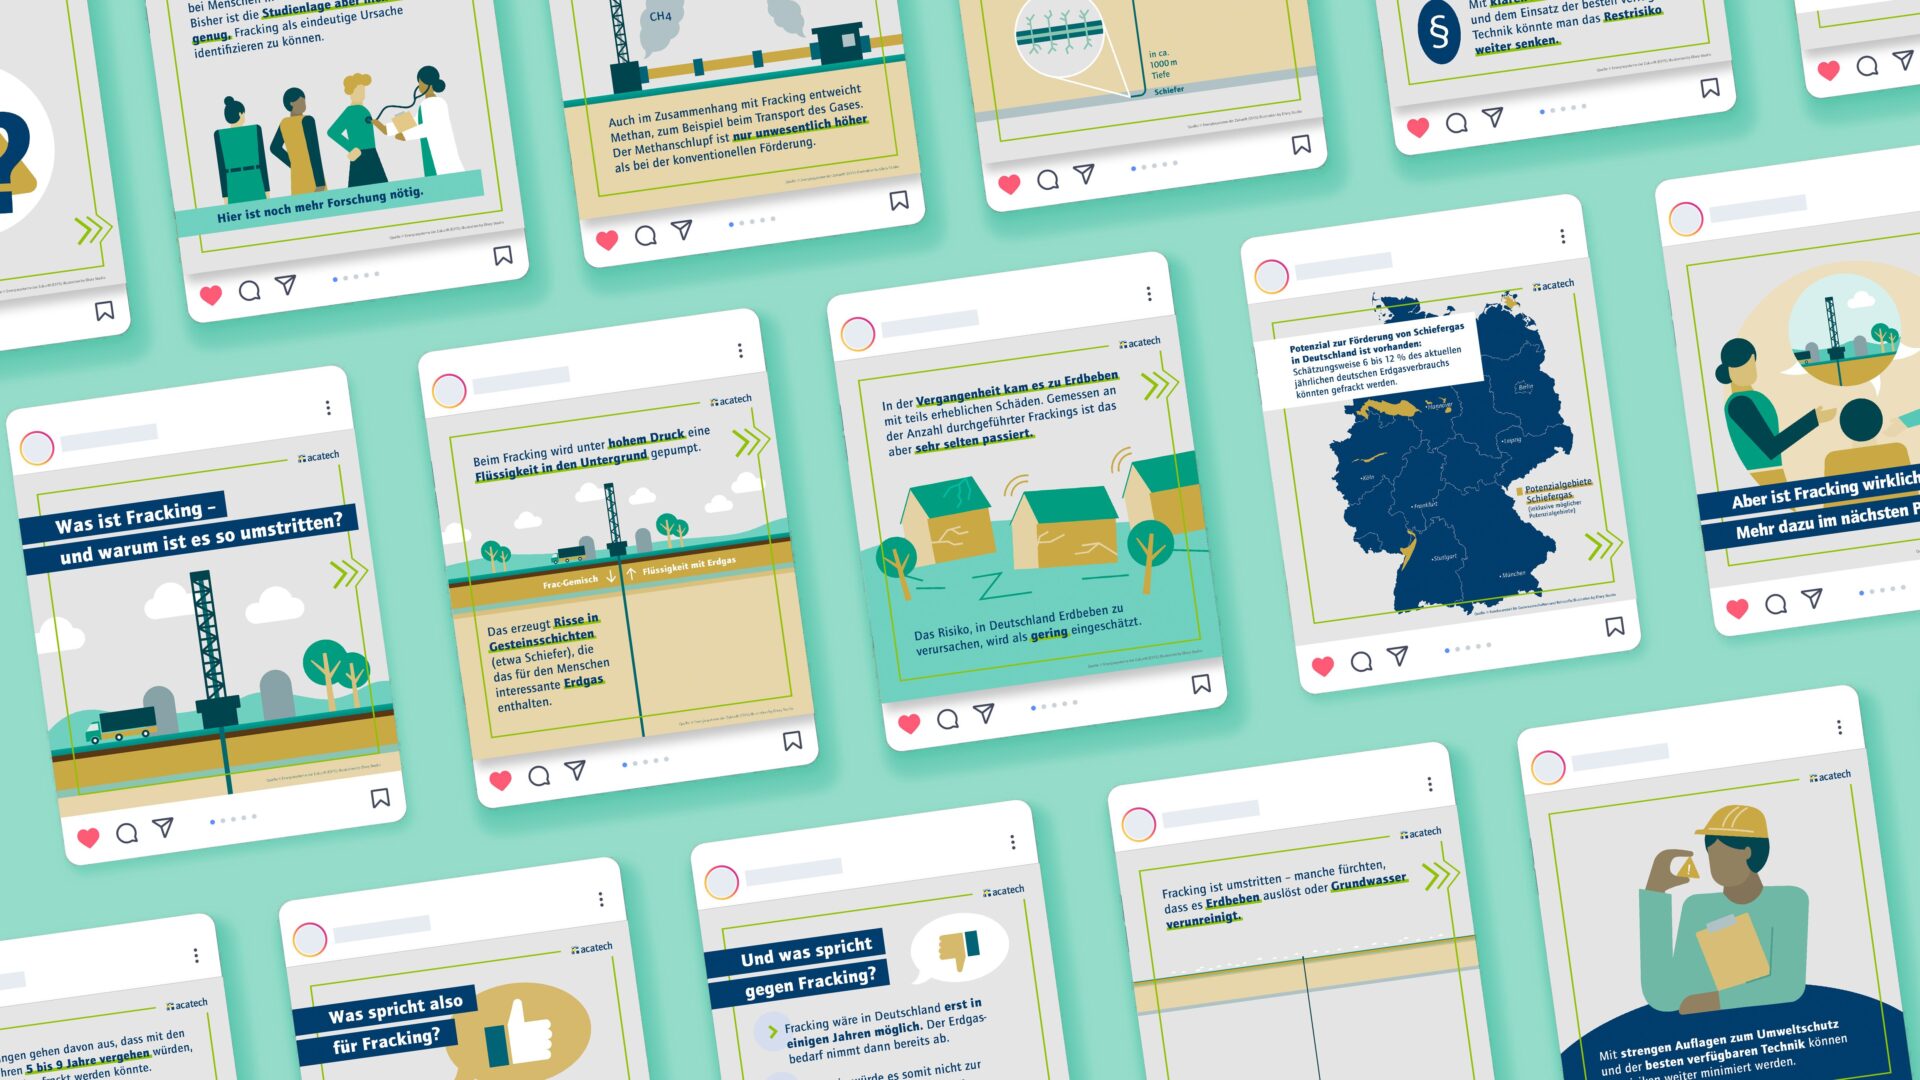
Infographic series and factsheets
For topics that don't end with a single graphic but need to be carried forward in modular formats.
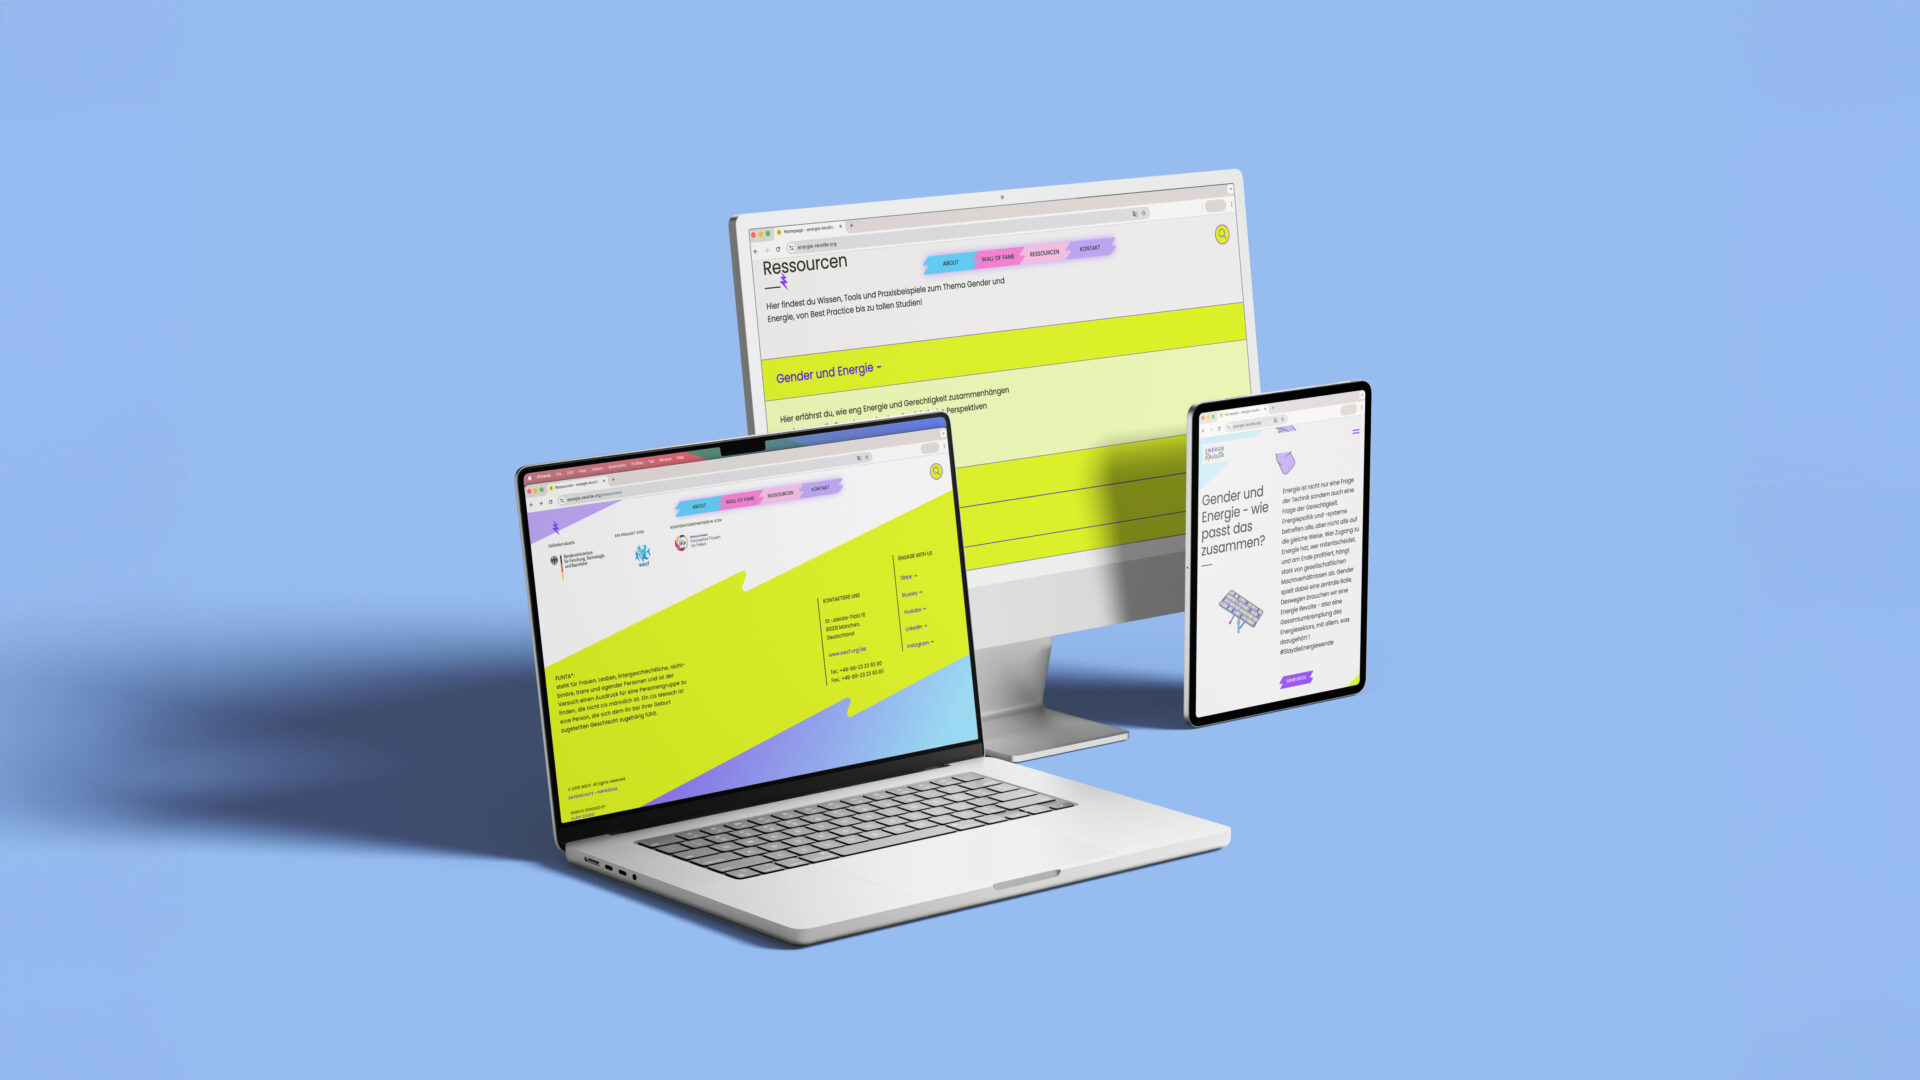
Digital knowledge platforms
We bring motion and interaction to your information: digital storytelling across dashboards, microsites, landing pages, and app environments.
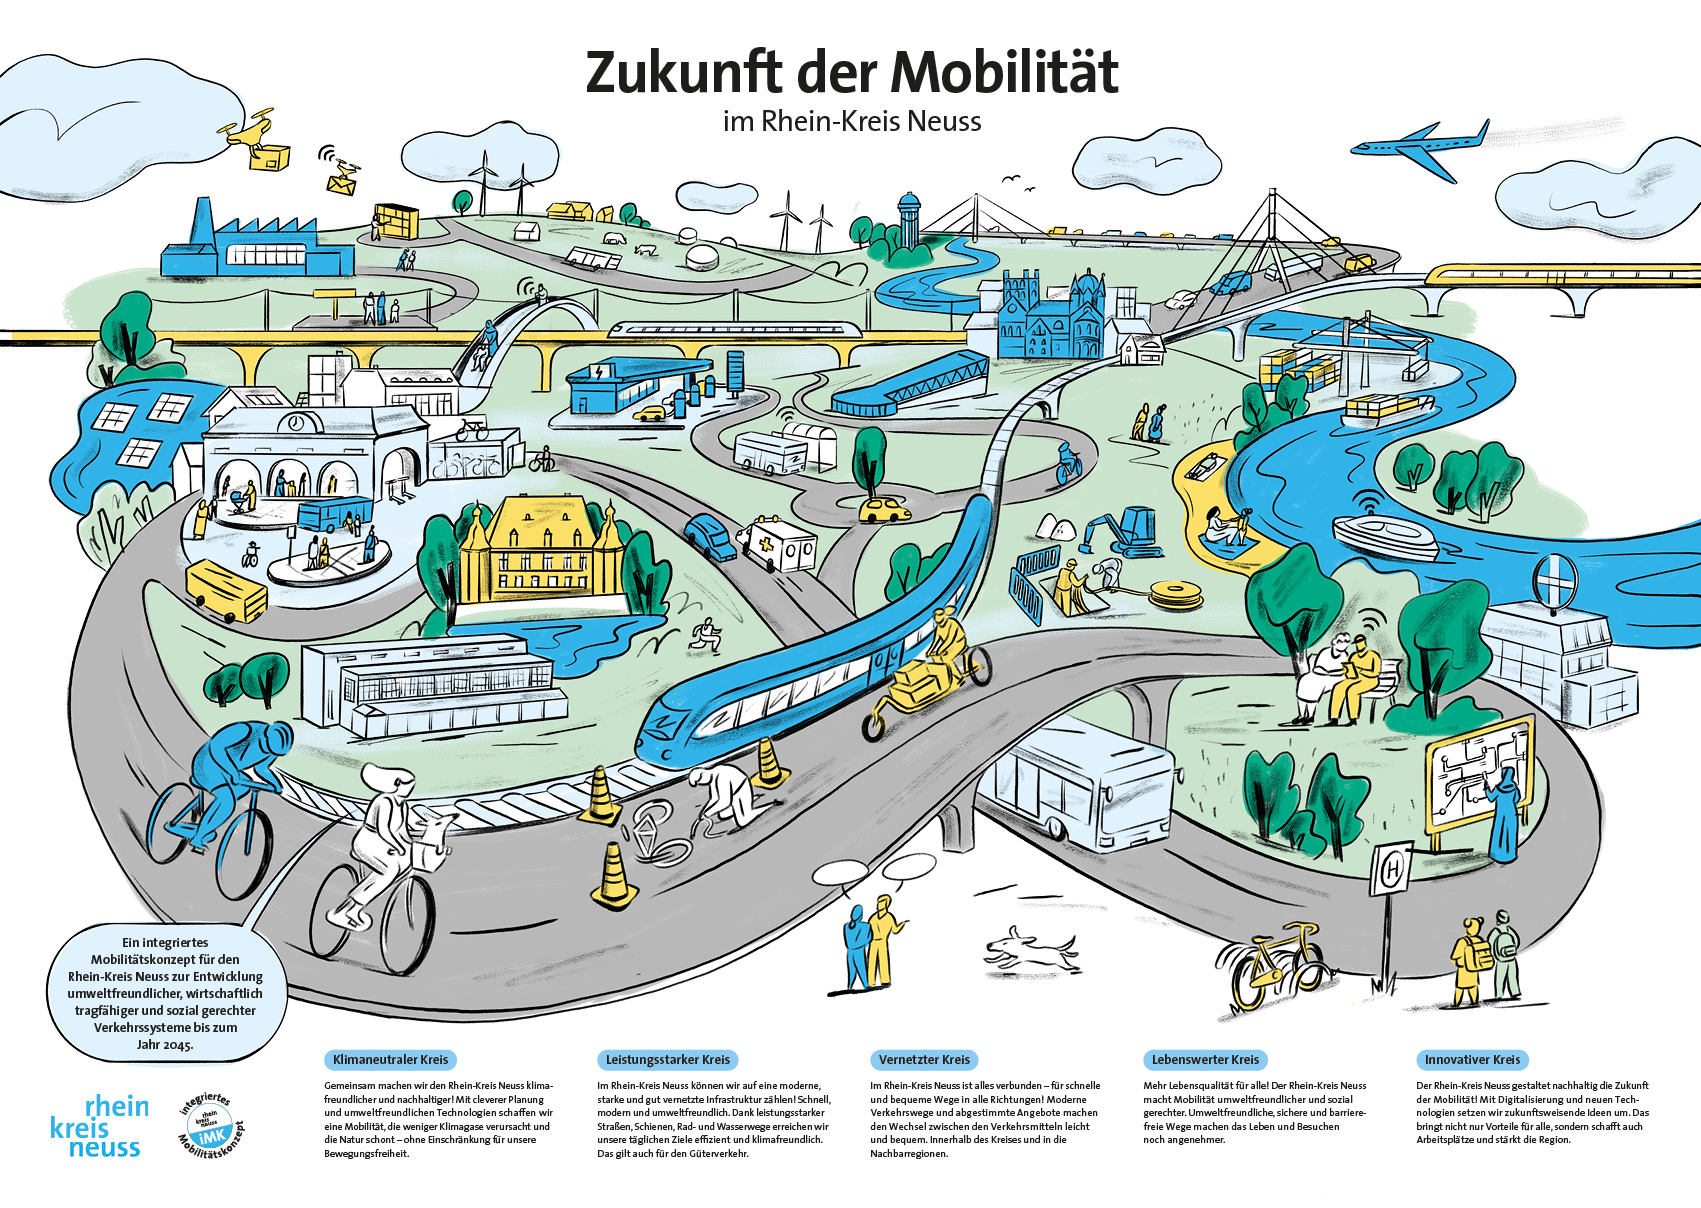
Strategic visualizations
For target visions, roadmaps, process diagrams, and complex initiatives that need to be communicated clearly, internally or externally.
Knowledge in space
Exhibitions, gallery walks, infographic sculptures, and spatial formats that convey content and make it literally tangible.
Meet the Team Behind Our Infographic Design Agency
Experts in data storytelling, illustration, and content development
With more than ten years of experience in research, design, and transformation work, we communicate complex content and passionately design entire information systems, from the first idea to public impact.

Let's talk!
👉 Request a free initial consultation.
Back to the services overview
Our strategic triad
Curious, creative, and fully committed, we don't just think along, we think ahead. We cut through complexity to move quickly into action. That's how we shape the future, share knowledge, and guide change.
Foresight
We shape futures
Strategic Foresight
Futures Research
Trend Radar
Speculative Design
Scenarios
Design
We communicate knowledge
Infographics
Data Visualization
Explainer Videos
Science Communication
Spatial Communication
Transformation
We guide change
Change Management
Organizational Culture
Workshop Facilitation
Participation Formats
Process Facilitation
